Back to December Calendar            ←Previous Entry                             Next Entry→

December 8, 2005

A First Function Plotter


As it stands as of yesterday, we can only simplify mathematical expression without variables.  My first goals for today are two-fold: less global variables (overall) and more variables (in the expression, at least one…).


I first found that I could tuck vString and its iterator into function parameters fairly easily, but they had to be part of the parameter lists for parse(),  gettok() and shift().  I then found it was quite easy to add a variable token, tVar, to the list of tokens (the sixteenth token with ID 15) and modify the algorithm to push the value of ‘x’ onto the val stack when encountered.  Here is a summary of the changes I made to get this new code


First, the new prototypes are

int parse(double x, std::vector<char>& vS, std::vector<char>::iterator& vSIter)

int gettok(std::vector<char>& vS, std::vector<char>::iterator& vSIter)

int shift(double x, std::vector<char>& vS, std::vector<char>::iterator& vSIter)

The main() function has been modified to declare the expression vector and its iterator and to fetch the value of the variable from the user:


int main(void) {

      double x; // variable

      another = true;

      static char str[MaxStr]; // static so it retains its value out of scope

      vector<char> vString(MaxStr); /* expression string */

      std::vector<char>::iterator vSIter = vString.begin();

      while(another) {

            //clear the decks

            opr.clear();

            val.clear();

            vString.clear();

            // Input the expression

            cout << "\nEnter a function of x (0 to quit):\n";

            //cin.getline(str, MaxStr);//gets(str);

            cin >> str;

            for(int i = 0; i < strlen(str); ++i) {

                  //cout << str[i];

                  if(str[i] != ' ') {

                        vString.push_back(str[i]);

                        //cout << vString.back();

                  }

            }

            //vString.push_back(tEos);

            cout << "\nBefore parse, string = "; printVector(vString);

            //cout << "\nvString = "; printVector(vString);

            vSIter = vString.begin();

            cout << "\nAt what value would you like to evaluate f(x)?  x = ";

            cin >> x;

            parse(x, vString, vSIter); cout << "\n = ";

            printVector(val);

      }

    return 0;

}


Thus, we can now do stuff like this:


Print debug stuff? (yes=1, no=0)0


Enter a function of x (0 to quit):

x*2.718^(0.01*x)


At what value would you like to evaluate f(x)?  x = 2


 = 2.0404

Print debug stuff? (yes=1, no=0)0


Enter a function of x (0 to quit):

(1+2*x)*1.01^x


At what value would you like to evaluate f(x)?  x = 2


 = 5.1005

Print debug stuff? (yes=1, no=0)


I’ve also added the Boolean flag erCh for turning on/off the error checking/debugging statements.


Now, how about nesting more global variables and working towards computing lots of input/output pairs with the ultimate goal of making a function plotter?   As we’ll need to introduce the OpenGL functions, most of the action will move to the display function, as shown below.  As it stands, this prototype will graph any function it can parse (parse() was modified to return a doublethe value of f(x).)   But there are various quirky aspects I have yet to iron out: like how it sometimes erases a plot before you can see itOpenGL pipeline issues.  Still, it’s a start!


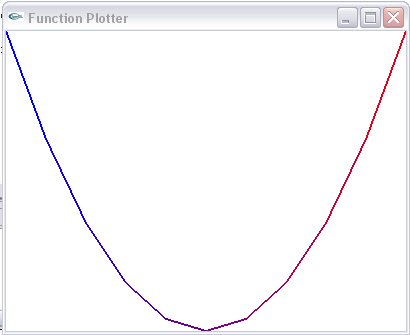
The simple evaluate function above has been adapted to loop within the OpenGL framework to sample the function in/out values at 11 evenly spaced points from x = -5 to 5 and then these are rescaled to fit the given window.  The expression string is entered once and then you need to reset the opr and val stacks for each parse:


//<<<<<<<<<<<<<<<<<<<<<<<< display >>>>>>>>>>>>>>>>>

void display(void){

      glClear(GL_COLOR_BUFFER_BIT); // clear the screen

      double x, y, ymax, ymin, m; // variable

      static char str[MaxStr]=""; // retains its value out of scope

      vector<char> vString(MaxStr); /* expression string */

      vector<char>::iterator vSIter = vString.begin();

      vector<char> opr(MAX_OPR); /* operator stack */

      vector<double> val(MAX_VAL);/* value stack */

      vector<double> yVals;  yVals.clear();

      vector<double>::iterator yIter = yVals.begin();

      vString.clear();

      // Input the expression

      cout << "\nEnter a function of x (q to quit):\n";

      cin >> str;

      for(int i = 0; i != strlen(str); ++i) {

            if(str[i] != ' ') {

                  vString.push_back(str[i]);

            }

      }

      vSIter = vString.begin();

      if(*str!='q') {

            glColor3f(0.0,0.0,0.0);

            for(x = -5.; x <= 5.; x += 1.) {

                  opr.clear();

                  val.clear();

                  vSIter = vString.begin();

                  yIter = yVals.begin();

                  y = parse(x, vString, vSIter, opr, val);

            yVals.push_back(y);

                  cout << "\n(x,y) = " << "("<<x <<", "<<y<<")";

            }

            ymax = yVals[0]; ymin = yVals[0];

            // get max and min y-vals to scale window

            for(yIter = yVals.begin(); yIter != yVals.end(); ++yIter) {

                  if(*yIter>ymax) ymax = *yIter;

                  if(*yIter<ymin) ymin = *yIter;

            }

            // scale the y-values

            m = (double)ver/(ymax - ymin);

            for(yIter = yVals.begin(); yIter != yVals.end(); ++yIter)

                  *yIter = m*(*yIter - ymin);

            yIter = yVals.begin();

            glBegin(GL_LINES);

                for(x = 0; x < (double)hor; x += (double)hor/10.) {

                    glVertex2f(x,*yIter);

                    glVertex2f(x+(double)hor/10,*(++yIter));

                }

            glEnd();

      }

      glFlush(); // send all output to display

}


I thickened the line width to 2.0 and did some color variations, so when I enter x^2 as my expression, here’s the plot: